How to Find the Best Profit First Bank for Your Bridal Business

-1.png?width=490&height=188&name=BV-PinkLogo(noCV)-1.png "BridalVision")

Imagine having the ability to see exactly what marketing and advertising you’re doing is leading to appointment bookings and revenue. This would allow you to only spend your time and resources on marketing channels that you know are driving results.You already know that digital marketing plays a huge role in your ability to reach brides and generate increased revenue. Many bridal stores set up a website and social media profiles and post pretty pictures, but if you want to use digital marketing to grow your business, it takes understanding your marketing analytics.
In the Google Analytics video walkthrough below, you will learn:
Skip Ahead in the Video:
00:38 - Adding the Google Analytics tracking code to your website
03:01 - Introduction to Google Analytics Reports
04:14 - Realtime Report
07:02 - Important Terms to Know: Users vs. Sessions, Bounce Rate, Session Duration
10:32 - The Five Primary Reports in Google Analytics
11:14 - Conversion Reports and Setting Up Goals in Google Analytics
15:16 - Audience Report
20:56 - Acquisition Report
21:49 - What the different types of traffic sources mean
25:45 - Behavior Report
Relevant Links Mentioned in the Video:
Keep reading to learn more about why Google Analytics is the ideal tool to understand how your marketing is performing, and a summary of the key terms and reports discussed in the video.
There are plenty of store owners who skip setting up analytics because they assume that they will do it later when they have more revenue or when they can hire someone to help with marketing. But these are bad excuses. It’s difficult (if not impossible) to determine whether or not the website you paid for or lovingly built is driving new appointments. And you can’t know exactly what you should focus your precious time on when you don’t have any data to make good decisions.
Google Analytics is the ideal solution for bridal stores — and really any small business — to start tracking their website traffic and online activity so that they can start to make better data-based decisions.
There are tons of analytics tools out there, so why Google Analytics?
Every website should have Google Analytics installed because it is a powerful, free tool that anyone can use to gain valuable insight into how their website is performing. It provides the insight you need in order to attract and close more customers. It is also fairly easy to set up and install, and there is countless documentation and YouTube videos online if you get stuck.
The first thing you need to do is to make sure your website is connected to Google Analytics, and then you can add the tracking code to BridalLive. Watch the above video for the complete walkthrough.
In general, you will need to:
.png?width=761&name=Screen%20Shot%202021-02-24%20at%201.54.55%20PM%20(1).png)
If you are not sure how to add the code to your website, I’d recommend looking up how to add Google Analytics code to your specific website builder, and you will be able to find an article or video detailing how.
Once Google Analytics is installed on your website, if you are a BridalLive user, you will also want to add the tracking code to BridalLive. This will give you insight into where your form submissions are coming from, and how many form submissions (appointments) are submitted over time. The best way to do this is to walk through the steps in this BridalLive article.
There are a few important terms to know to help you make sense of the numbers in Google Analytics. We cover a few of them here. You can also hover over many of the metrics on the Overview page in your Analytics account for each report to get a definition of the terms if you forget.
.png)
Let’s cover a few of the key performance indicators.
The number of users is how many individuals visited your website. An individual visitor might go to your website more than once over a period of time, and each separate visit is what Google calls a session. So, for example, if someone clicks on your website from Instagram in the morning, and then they exit their website browser, but then that night they go back to your website, that would count as two sessions.
Session duration is a fancy way of saying the average amount of time people are spending on your website.
A standard average session duration is between 2-3 minutes. A session duration over 3 minutes is usually a great sign.
If your session duration is low, then it could indicate that visitors are not able to quickly find what they need, so they leave the website, and in most cases, move on to the next businesses’ website. This can also happen when your website is not user-friendly — for instance, the copy on your website is difficult to read or not easily scannable for those visiting from their mobile devices.
Bounce rate is an important metric because it tells us what percentage of visitors landed on your website and then exited. Essentially, these visitors only viewed one page on your website, and then left without browsing or going to any other pages.
Typically, a good bounce rate is considered to be under 40%. The lower your bounce rate is, the better because it means visitors are not simply landing on your website and then leaving. We want visitors to come to the website and stick around for a while — when visitors are spending more time on the website and viewing other pages, it indicates that they are engaged with the content.
Next, let’s move on to some more detailed reports.
When you are signed in and go to www.analytics.google.com, you will be taken to your home screen. At the top left of your screen, it will show you what Google Analytics account you are viewing. If you have more than one business, and therefore have different analytics accounts, make sure you are viewing the right business account. For the purpose of this article, we’ll be looking at an example blog website.
On your home screen, you’ll see a mix of different reports from the five main report types — Realtime, Audience, Acquisition, Behavior, and Conversions. We will look at each of these and see what you can learn from the different reports.
.png?width=760&name=a%20mix%20of%20different%20report%20HOME%20SCREEN%20(1).png)
At a high level, the five different types of reports on the left-hand side of your account include:
The Conversions report displays the results related to any goals you have set up. Goals in Google Analytics can be set up to track actions that you want visitors to take. For example, signing up for your newsletter or submitting an appointment scheduling form.
The video walkthrough above shows how to set up an example goal, and below is a screenshot showing how you might set up a goal to track after a visitor submits a form.
For instance, if I wanted to track when a visitor books a discovery call, in this case, after the visitor submits the discovery call booking form, they are redirected to a confirmation page on the website. When someone lands on this thank you page, I know that they completed the goal of booking their call. In the Goals section of Google Analytics, we can use this confirmation page url to tell Google to track a goal completion any time a visitor lands on that page.
Below is an example of what this looks like:
.png?width=759&name=Screen%20Shot%202021-02-24%20at%201.57.47%20PM%20(1).png)
These are the basics of Goals, and once you have Goals set up, you’ll be able to go into the Conversions reports and view data around goals.
The Realtime report is a snapshot of active users on your website in real time — basically, it’s showing you how many people are on one of your website pages right now.
You can click into this report to get more information about who is on your site at this very moment. This includes where these visitors are located, and how they got to your website. For example, they may have been referred from Instagram, Facebook, a google search, etc.
.png?width=760&name=Screen%20Shot%202021-02-26%20at%201.15.24%20PM%20(1).png)
The Audience Report helps you see who your website visitors are. You can even parse out certain subsections of your audience. We won’t dig into this here, but you can explore more with Audience Reports and creating audiences in Google’s support article.
In the Audience Overview, you can adjust the timeframe you’re looking at, and you can see the number of individuals who visited the website. The breakdown between new and returning visitors illustrates what percentage of your visitors have been to the website before versus those who are brand new visitors. You can also see the average number of pages visited per session.
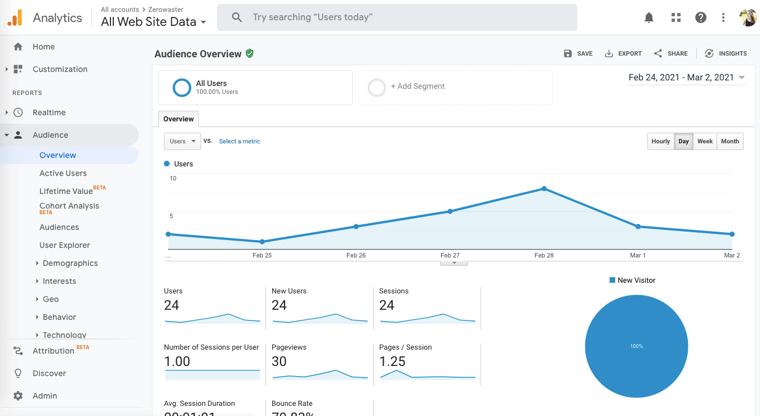
The session duration is pretty terrible on this example site! Therefore, it makes sense that the bounce rate would be on the high side, as many of the visitors are landing on the site and immediately leaving.
Scrolling down towards the bottom of the Overview, we can learn more about the breakdown of what languages our website visitors speak. Of course, if your store is located in a primarily English speaking country and you are serving English speaking brides, you would want to make sure that your website visitors align with this. You’ll also see the breakdown of what country and city your visitors are from.
Under “System,” you can learn what browser (Safari, Chrome, etc.) and Operating System (iOS for Apple users, for example) your visitors use. And in “Mobile” you can view the breakdown of Apple users compared to Android users. This can be relevant for a bridal store in that when you make changes to your website, you can make sure you are previewing your website on the device and browser that most of your visitors are using.
This report illustrates where your website visitors are coming from. There are a few key channels or sources that your website visitors come from.
.png?width=759&name=Screen%20Shot%202021-02-24%20at%201.57.16%20PM%20(1).png)
When you’re starting out with Google Analytics, it’s really great to use this report to get a feel for where your visitors are coming from (organic search, social media, etc.). It can also help you inform which channels to focus your time and resources on. For example, if you notice that most of your conversions are coming from Instagram, you might want to shift efforts to improving your strategy on Instagram.
In the Behavior Overview Report, we can see what people are doing on our website. This can give us an understanding of how much time visitors are spending on the website and what pages they are visiting.
The bounce rate, as we’ve discussed, is the percentage of visitors who landed on the site and then immediately bounced or left. The exit rate is the percentage of visitors who exited from that page or set of pages. If you have a website page that most visitors are viewing and then exiting the site from, there may be something that isn’t loading on the page or another issue that you can dig into.
If you scroll down in the Overview report, you can view a breakdown of the most common pages by number of page visits for any time period. This can help you think about what website pages you should focus on. The more traffic there is to a certain page, the bigger impact any changes and improvements to that page will have.
On any reporting view in Google Analytics (except for the Realtime Report, which is displaying information in real time), you can customize the date range for which data is being pulled.
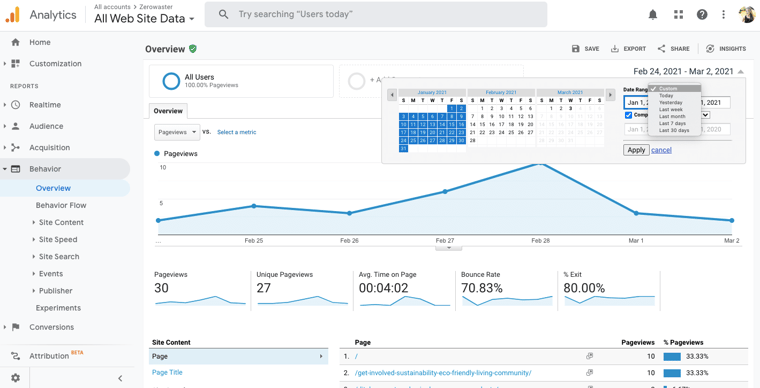
For example, you can view information about the last 7 days, last 30 days, last 90 days, month-over-month, year-over-year, and any custom timeframe. This is particularly valuable when it comes to measuring your marketing performance over time. For example, you could compare a month where you were posting twice as much as typical on Instagram to the previous month or previous year. This would allow you to see what impact your activity had on website visits and conversions. Or, for instance, you can compare the number of sessions on your website this year compared to this time period last year.
The best way to get familiar with Google Analytics is to open your account and start playing around with the different reports. If you would like to continue learning more about how to use Google Analytics to make better business and marketing decisions, you can learn analytics through Google’s free online academy.
Have more questions about digital marketing for bridal shops? We go deep in the Bridal Store Profit Accelerator — Learn more about the program and join our next call!
I hope this helps you gain more insight into your customers and your business!
